| Launch:2023-12-15 |
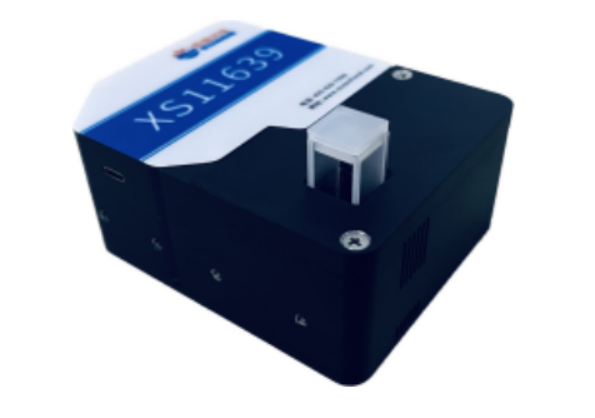
The integrated liquid absorbance application solution is a highly integrated solution for measuring visible light absorbance and transmittance of liquid samples. The solution integrates accessories, spectrometers, light sources and sample cell brackets necessary for liquid absorbance or transmittance measurement. Compared with the construction type, it is small and convenient, avoids the tedious construction, only needs a USB data line to connect with the PC end, and supplies power to the spectrometer through USB without external power line.
Beer-Lambert Law
Lambert-Beer's law is the theoretical basis for quantitative analysis of ultraviolet-visible absorption spectroscopy. A beam of monochromatic light irradiates the surface of an absorbing medium. After passing through a certain thickness of the medium, because the medium absorbs part of the light energy, the intensity of the transmitted light will be weakened. The higher the concentration of the absorption medium is, the thicker the thickness is, and the more obvious the light intensity decreases. Its mathematical expression is as follows:
A=lg(1/T)=Kbc
An is absorbance, T is transmittance (transmittance), and outgoing light intensity (I) is specific to incident light intensity (I0).
K is the molar absorptivity. It is related to the properties of the absorbing material and the wavelength λ of the incident light.
C is the concentration of light absorbing material, mol/L,b is the thickness of absorption layer, and unit is cm.
Determination of sample concentration by absorbance
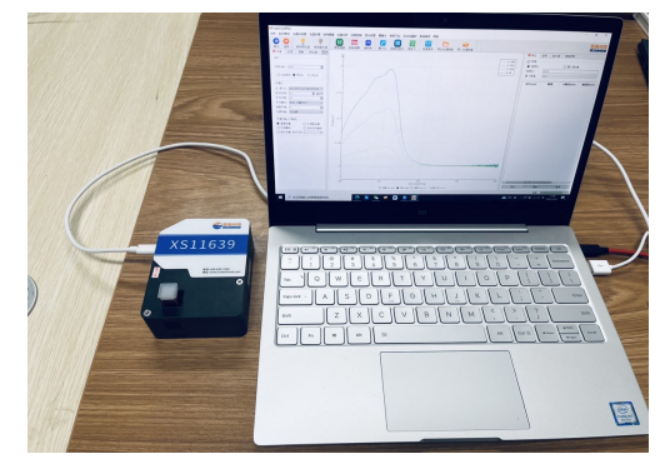
Figure 1 Test scenario
Taking the sample of iron ion solution as an example, after adding chromogenic agent an and b, there is a maximum absorption peak at 508nm in the visible region. Because the absorbance of iron ion solution in the visible region is proportional to the content, which accords with Lambert-Beer 's law, the standard curve of iron ion concentration-absorbance can be drawn by UV-vis absorption spectrometry.
The iron ion solutions with concentrations of 0.448mg/L, 0.896mg/L, 1.792mg/L, 2.688mg/L and 4.48mg/L were prepared, and chromogenic agent an and b were added to shake well and set fully, in which the solution of 1.792mg/L was used as the sample to be tested with unknown concentration. Using pure water as the reference solution, the spectrum is collected as shown below:
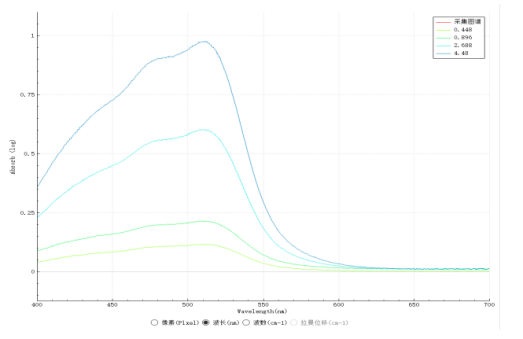
Fig. 2 absorption spectra of iron ion solutions with different concentrations
The maximum absorption peak wavelength, namely absorbance at 508nm, was selected as the basis for quantitative analysis. Fill in the absorbance values at each concentration 508nm in Table 1.
Table 1: absorbance of iron ion solution at 508nm

Draw the standard curve for the quantitative analysis of iron ions, as shown in figure 3:
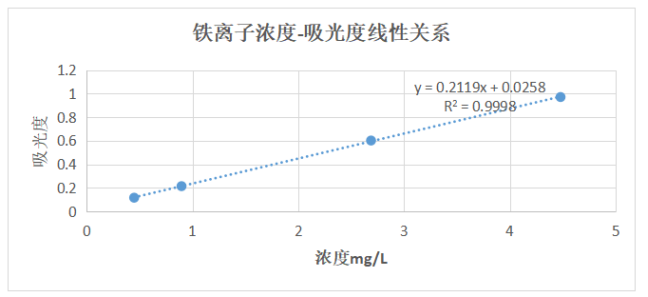
Fig. 3 Linear fitting curve of the relationship between absorbance and concentration at 508nm of iron ion solution
By substituting the absorbance 0.401558 of the unknown sample into the equation of the standard curve, it is concluded that the concentration of the unknown iron ion sample is 1.773mg/L, while the real concentration is 1.792mg/L, and the experimental measurement error is 0.018mg/L.
Integrated SS-VT-01 spectrometer
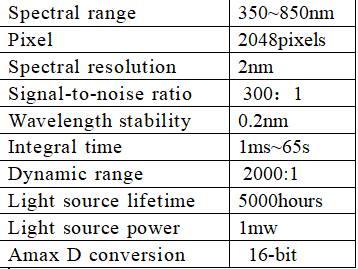
The SS-VT-01 spectrometer is equipped with a highly sensitive linear CMOS image sensor, together with the 16-bitA/D sampling module to provide the spectrometer with excellent spectral signal response and extremely wide response range. At the same time, the compact structure design and stable circuit design ensure that SS-VT-01 can ensure excellent spectral resolution, signal-to-noise ratio and temperature stability under the premise of micro-size.
The LED cold light source and the colorimetric dish bracket are integrated to provide a stable light source in the visible band. The light is controlled by the software, the light output is slightly adjustable, the percentage adjustment is supported, and the maximum output is about 1mW.
Oceanhood Optoelectronics's unique Uspectral-PLUS software is a spectrometer analysis system that integrates spectrum collection, data analysis and database management, which supports Windows,Linux system, real-time monitoring of spectral changes and high-speed data acquisition. At the same time, the periodic collection mode can be configured to detect the absorbance transformation of the whole reaction process. In addition, Uspectral-PLUS also configures the PLA modeling algorithm to model the standard curve in the software.
Equipment parameters

上海如海光电科技有限公司400-820-7939
