| Launch:2023-11-28 |
Hot current events 16
On August 27, a 30-section CCTV News reported that the Market Supervision Bureau of Yuyang District, Yulin City, Shaanxi Province found that the celery food sold by an individual industrial and commercial household was not up to standard. The measured value of chlorpyrifos is 0.11mg/kg, and the maximum residue limit of pesticides in food safety national standard (GB2763-2021) is 0.05mg/kg. In violation of the regulations, the party concerned will be fined 66000 yuan.

Source of video picture: "CCTV online Quick look"
This social incident has aroused widespread public debate, so what is chlorpyrifos?
The chemical name is OMagol-diethyl-O-(3pyrrol-6-trichloro-2-pyridyl) thiophosphoric acid, which is white crystal and has a slight mercaptan odor. It is a non-absorbent broad-spectrum insecticidal and acaricidal agent. Chlorpyrifos has environmental persistence and bioaccumulation, it can enter the human body through people's drinking water, food, shelter, and even breathing air, distribute in blood and saliva, act on nervous, immune, reproductive, endocrine and other organ systems, and even affect fetal growth and development; it may also cause genotoxicity such as DNA damage, gene mutation, chromosome aberration, etc. Induce cell carcinogenesis and increase the risk of lung cancer, leukemia and other cancers.
Fast detection method
A rapid detection method of chlorpyrifos in tea was developed based on surface enhanced Raman spectroscopy. Combined with ICPA-mRMR algorithm, the rapid quantitative detection of chlorpyrifos pesticide residues in tea was realized, and there was no significant difference between ICPA-mRMR prediction value and LC-MS/MS detection value.
Surface enhanced Raman spectroscopy (SERS) is the extension and development of Raman spectroscopy. The high specificity of SERS= Raman spectra + local surface plasmon resonance + high sensitivity provided by metal nanostructures, so SERS not only inherits the high specificity of Raman spectra, but also can enhance the Raman signals of molecules to be measured by millions of times or even more.
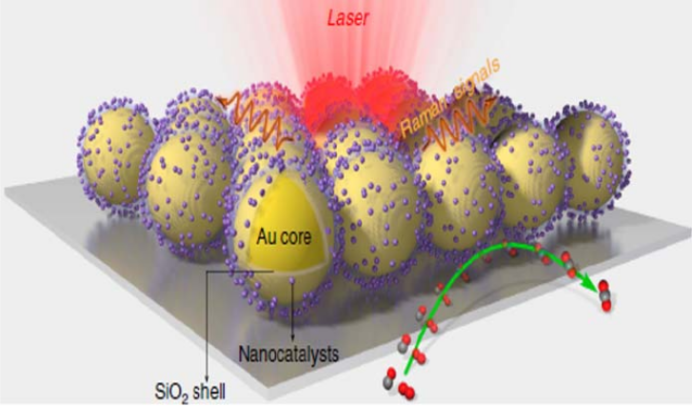
Fig. 1 schematic diagram of surface enhanced Raman scattering of metal nanoparticles
[From H. Zhang, C. Wang, H. L. Sun, et al In situ dynamic tracking of heterogeneous nanocatalytic processes by shell-isolated nanoparticle-enhanced Raman spectroscopy[J]. Nature Communications, 2017, 8:15447.]

Fig. 2 (A) schematic diagram of SERS detection system; (B) SPL-Raman-785 micro-Raman spectrometer
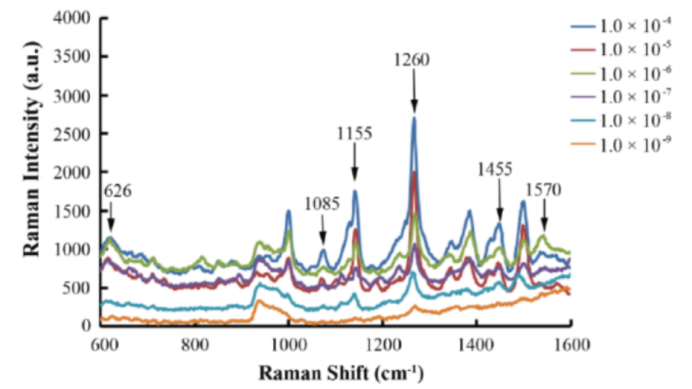
Fig. 3 SERS spectrum of chlorpyrifos pesticide residues in tea
Characteristic peak (cm-1) | Characteristic peak attribution |
626 | ν(P=S) |
1085 | ν(P-O-R) |
1155 | δs (C-H) |
1260 | Ring stretching mode |
1455 | δs (C-H) |
1570 | Ring stretching mode |
Note: v represents stretching vibration and δS represents symmetrical bending vibration.
Table 1 assignment of SERS spectral characteristic peaks of chlorpyrifos
Combined with ICPA-mRMR algorithm, the rapid quantitative detection of chlorpyrifos pesticide residues in tea was realized, and there was no significant difference between ICPA-mRMR prediction value and LC-MS/MS detection value.
The SERS spectrum of chlorpyrifos pesticide residues in tea was detected based on SERS detection system, and the detection sensitivity was at least 1.0 × 10⁻⁹g/kg. The EU maximum residue limit (MRLs) for chlorpyrifos in tea is 0.1mg/kg (1.0 × 10⁻⁵g/kg). The above results show that the SERS detection system can meet the sensitivity requirements of EU standards, and has the advantages of simple construction, easy to use, good stability and reliability. Based on this, the quantitative study of SERS spectra of chlorpyrifos pesticide residues in tea was carried out, as shown in Fig.4.
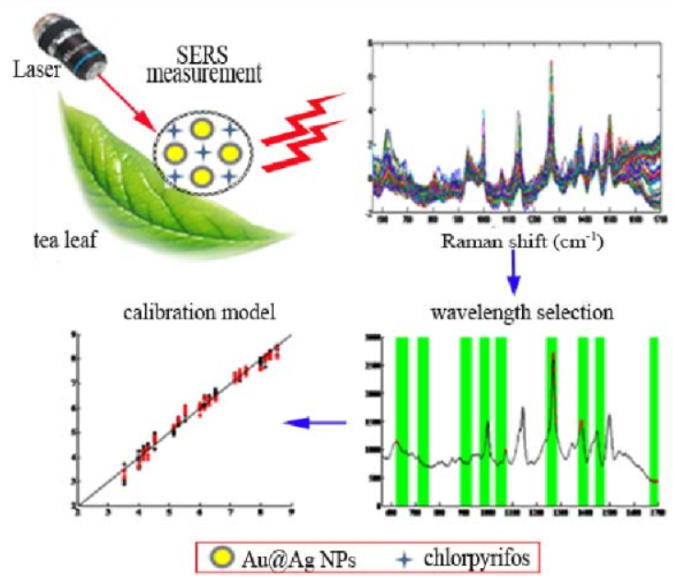
Fig. 4 schematic diagram of rapid detection of chlorpyrifos pesticide residues in tea
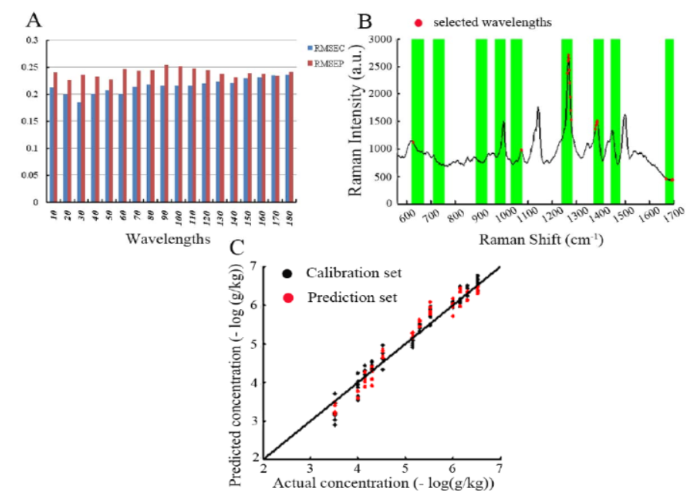
Fig. 5 (A) the changes of RMSEC and RMSEP values of the calibration model with the participation of different wavelengths; (B) the distribution of characteristic wavelengths screened by ICPA-mRMR; (C) the relationship between the predicted values of chlorpyrifos pesticide residues in tea and the real values determined by LC-MS/MS.
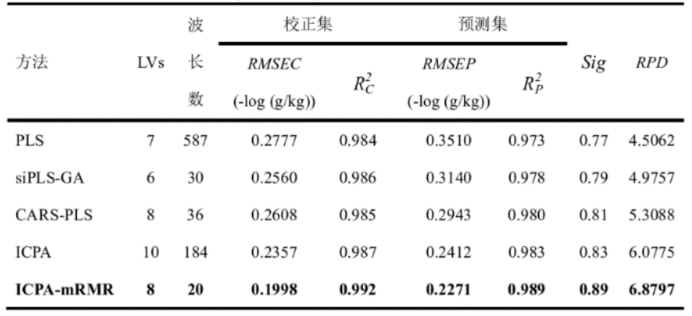
Table 2 quantitative test results of each algorithm model
In this study, the rapid and quantitative detection of chlorpyrifos pesticide residues in tea was realized based on SERS detection system and ICPA-mRMR. Firstly, a new characteristic wavelength filtering-modeling algorithm ICPA-mRMR is proposed. In the stage of optimal wavelength subinterval screening, BMS, EDF and MPA are embedded in ICPA for wavelength subinterval sampling, wavelength subinterval spatial contraction and wavelength subinterval cluster analysis. Secondly, on the basis of screening the optimal wavelength sub-interval, the mRMR algorithm is used to further screen the characteristic wavelengths to remove redundancy. Then, ICPA-mRMR, PLS, siPLS-GA and CARS-PLS were used to quantitatively detect chlorpyrifos pesticide residues in tea. The results showed that ICPA-mRMR had the least characteristic wavelength and the best prediction performance. Finally, the t-test was done between the predicted value of ICPA-mRMR and the measured value of LC-MS/MS, and the results showed that there was no significant difference between the predicted value of ICPA-mRMR and the measured value of LC-MS/MS. Therefore, this method can be used as a powerful tool for rapid and quantitative detection of single pesticide residues in tea.
Instrument recommendation: MR-3CHANNEL-Portman785
The SPL-Raman-785 micro-Raman spectrometer used in this study has been upgraded to MR-3CHANNEL-Portman785.
Autofocus, mapping, hyperspectral, automatic mobile platform, supporting multiple wavelengths, widely used in biomedical, photoluminescence, microplastics, two-dimensional material graphene and other scientific research fields.
MR532/785/1064 micro-Raman spectrometer is composed of Raman three-channel module, LED light source, metallographic microscope and so on. The operation is simple, the collection speed is fast, and the microstructure and Raman spectrum information of the sample are observed in a short time, which can quickly help users to detect and analyze the sample. It is widely used in biomedical, photoluminescence, microplastics, two-dimensional material graphene and other scientific research fields.
Oceanhood self-developed Raman three-channel module can support Raman spectra measurements at any three different excitation wavelengths, such as 532nm, 633nm, 785nm, 830nm, 1064nm and so on. The optical path switching system is configured in the module, which can quickly switch between different wavelengths through software, and the collected Raman spectra can be superimposed and compared. The probe on the module can be plug and play, which is convenient for the detection of unconventional samples. The Raman three-channel module can be customized according to the user's existing microscope and assembled into a micro-Raman spectrometer.
It can support the expansion of the Mapping platform (that is, Raman spectrum imaging function), and can carry out Raman spectrum imaging of the sample micro-region. The chemical composition distribution, surface physical and chemical properties and other more information of the sample are directly displayed in the way of image. High-precision mobile platform, with a minimum step of 1 μ m, can accurately detect the Raman signal of the sample. The software has perfect functions, which can realize auto-focusing function, bright-field image stitching and mapping image display.
Reference
[1]戴红梅,邓媛英,张辰,赵玲玲.毒死蜱暴露对健康危害研究进展[J].中国公共卫生,2016,32(07):995-998.
[2]朱家骥. 基于表面增强拉曼光谱(SERS)技术的茶叶中农药残留快速检测方法研究[D].江苏大学,2020.
[3] R.J.C. Brown, M.J.T. Milton, Nanostructures and nanostructured substrates for surface—enhanced Raman scattering (SERS)[J]. Journal of Raman Spectroscopy, 2008, 39:1313-1326.
[4]H. Zhang, C. Wang, H. L. Sun, et al. In situ dynamic tracking of heterogeneous nanocatalytic processes by shell-isolated nanoparticle-enhanced Raman spectroscopy[J]. Nature Communications, 2017, 8:15447.

